The s–t graph for a train has been experimentally
determined. From the data, construct the v–t and a–t graphs
for the motion; 0 < t < 40 s. For 0 < t < 30 s, the curve is
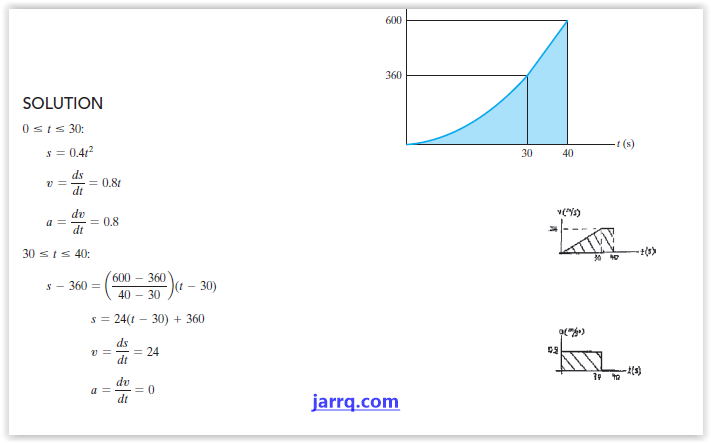
The s–t graph for a train has been experimentally
determined. From the data, construct the v–t and a–t graphs
for the motion; 0 < t < 40 s. For 0 < t < 30 s, the curve is
s = (0.4t^2) m, and then it becomes straight for t t>30 s.
EmoticonEmoticon