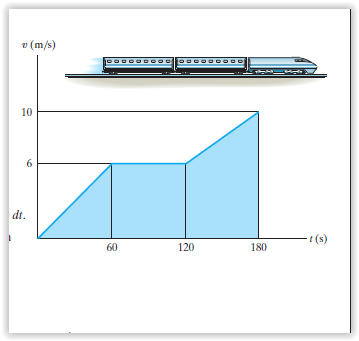
The v–t graph for a train has been experimentally
determined. From the data, construct the s–t and a–t graphs
for the motion for 0 < t < 180 s. When t = 0, s = 0.
Click on the image to view it clearly
The v–t graph for a train has been experimentally
determined. From the data, construct the s–t and a–t graphs
for the motion for 0< t <180 s. When t = 0, s = 0.