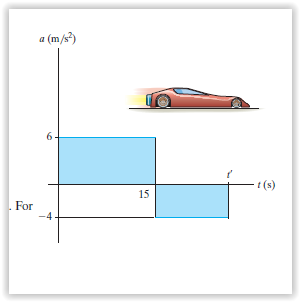
The v–t graph for a particle moving through an electric field
from one plate to another has the shape shown in the figure.
The acceleration and deceleration that occur are constant
and both have a magnitude of 4m/s If the plates are
spaced 200 mm apart, determine the maximum velocity v max
and the time for the particle to travel from one plate to
the other. Also draw the s–t graph. When the
particle is at s = 100 mm.
t = t/2
Click on the image to view it clearly
The v–t graph for a particle moving through an electric field
from one plate to another has the shape shown in the figure.
The acceleration and deceleration that occur are constant
and both have a magnitude of 4m/s If the plates are
spaced 200 mm apart, determine the maximum velocity v max
and the time for the particle to travel from one plate to
the other. Also draw the s–t graph. When the
particle is at s = 100 mm.
t = t/2